
In my prior post about daylighting analysis, I focused on a ‘representative points’ approach, i.e. taking as typical a mid-morning and mid-afternoon time on the vernal equinox, along with perhaps some bounding points on the winter and summer solstice, and extrapolate the quantity and quality of natural light from there. I was interested to know if a more granular approach would confirm the validity of this method, and what other useful information it might yield besides.
I set the computer up to run a calculation for every 30 minutes, on thirty day intervals throughout the year, for CIE Cloudy, Partly Cloudy, and Clear skies. That made for some 600 radiosity calculations in all, so after queuing all that up, I let my desktop run for about two weeks straight.
Untold processor cycles later, I had hundreds of text files that looked like this:
[table id=18 /]
So this was not a terribly useful format for the data to be in what I wanted to do, because I was interested in the behavior of the average and minima of, for example, the “Books Adult Stack 2” fields as they span all the files that I have, not the value of any one particular field. Also, the files were named things like sample_3.txt and my computer crashed several times during all this so I had several files with the same name etc. etc. etc. agggghhhh.
Anyway, after trying any number of other things, I wrote some bash scripts to collate and assemble the data for me. I’m told that future releases of AGI will have more sophisticated data output options, but in hopes they come in handy for someone else, here’s the script I wrote:
[cc]
#!/bin/bash
echo "Usage: sh extract.sh filename.txt (or *.txt)"
echo ""
echo "Script does two things: creates csv files from a tab delimited input with the pertinent fields in the file names, and collates those parameters along with other data to a central csv file called extract.csv"
echo ""

for filenam in "$@"
do

	#extract the values of the Conditions, Date, and Time fields
	# to a string, with an underbar delimiter
	timestring=$(awk 'BEGIN{ FS="\t"; RS="\r\n"}
		/Conditions/ {print $2"_"}
		/Date/ {print $2"_"}
		/Time/ {print $2}
		END {}' $filenam)

#put the fields you want to match in the /.../, and the fields you want
#returned after the print command
	datastring=$(awk 'BEGIN{ FS="\t"; RS="\r\n"}
		/Main Room RHS/ {printf "_"$1"_"$3"_"$4"_"$5}
		/Floor/ {printf "_"$1"_"$3"_"$4"_"$5}
		/Books Adult Stack 2/ {printf "_"$1"_"$3"_"$4"_"$5}
		/Check in 1_Surface_5/ {printf "_"$1"_"$3"_"$4"_"$5}
		/Computer Area/ {printf "_"$1"_"$3"_"$4"_"$5}
		/Adult Reading Workplane/ {printf "_"$1"_"$3"_"$4"_"$5}
		/Childrens reading area/ {printf "_"$1"_"$3"_"$4"_"$5}
		/Adult Reading Workplane/ {printf "_"$1"_"$3"_"$4"_"$5}
		/Entry Vestibule/ {printf "_"$1"_"$3"_"$4"_"$5}
		/Adult Stack 1/ {printf "_"$1"_"$3"_"$4"_"$5}
		END {}' $filenam)

	#read it out to the terminal, just for confirmation
	echo $timestring

	filenamappend=$(echo $timestring  | tr ":" ".")
	echo $filenamappend

	#extract the base name without extension for concatenation
	dfile=`basename $filenam`
	dfile=${dfile%.*t}

	#create a .txt file with the conditions in the filename
	tr "\\t" "," < $filenam > ${dfile}"_"${filenamappend}.csv

	#send it to one csv file, changing the delimiter to commas
	echo $timestring$datastring | tr "_" "," >> extract.csv

done
[/cc]
Also, so that I could make pretty graphs. Like this one here:
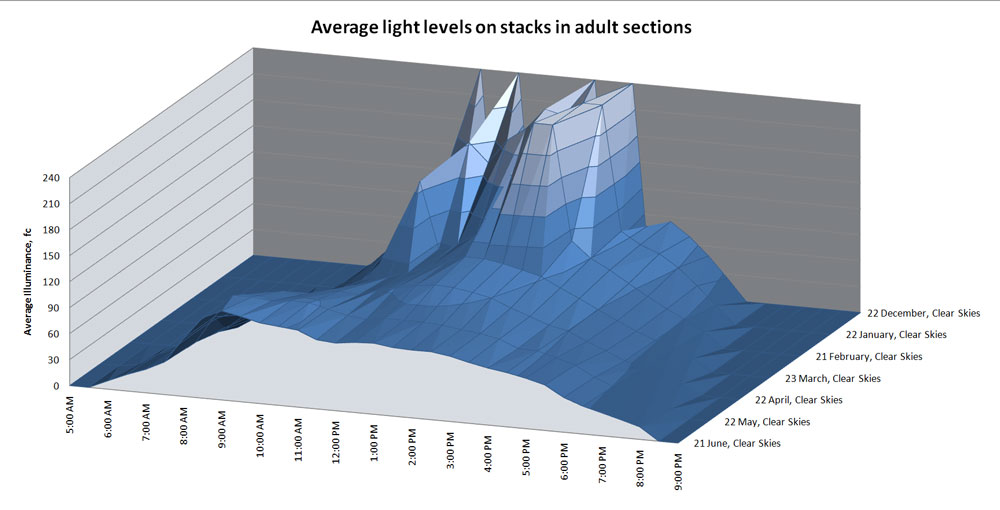
This portrays average footcandle levels on the vertical surface of a section of stacks in adult section. The levels are very uniform throughout the day (x axis) and year (y axis), except during the winter months, where for a few hours each day there is a large spike in the values. Since those values are an order of magnitude larger than anything else, they must be caused by direct sunlight. Since they are occurring in the winter months, I would guess that they are due to sunlight through the windows, rather than the skylights above. A quick peek at the full-color rendering confirms this.
That behavior would have been discovered if daylighting analysis was done for the ‘worst-case’ summer/winter solstices, but not if only data for the ‘typical’ equinoxes were generated. It’s important to look at those outliers, is what this graph is telling us.

Variability of sky conditions: Some daylighting programs can take as an input a weather file containing average sky luminances based on weather station measurements. This is the preferred method for daylighting analysis, but day-by-day sky conditions can vary from cloudless to totally overcast on any day of the year, particularly in Berkeley where this library is to be located.
A question I had was how much numerical variation there is in interior lighting levels between a sunny day and a cloudy day, just as a practical rule-of-thumb. An average sky condition might be less meaningful if there’s more than an order of magnitude difference between lighting levels on a sunny and cloudy day, since we are concerned about the occupant experience on atypical days as well.
This may be somewhat difficult to visualize, but we are interested in the ratio of average lighting levels between clear sky days and cloudy days, i.e. the space over which weather would affect measured lighting levels. I found a fairly insignificant ratio of up around 2:1 or 3:1 during times when there is no direct sun in the space, and a fairly significant ratio of 5:1 up to 11:1 when direct sun enters the space. For example, the average lighting levels mid-day in the winter varied from 42fc for overcast days up to 470fc for sunny days (!). A close-up of that data:

The take-away would seem to be that unless there is penetration by direct sun into the space, a typical climate can be used to approximate any weather condition. Notably, the greatest variation in lighting levels due to sky condition was at mid-day points where there was more than enough light in the space in any case.
Cost vs. benefits of dimming: One question that came up in the design process was the cost/benefit of dimming vs. switched daylight harvesting. For example, for the computer use area in the main room, we might desire a minimum of 30fc on the task plane 30″ above the floor, as this is sufficient to do the sort of paper tasks that might be performed at this location. The electric lighting could be controlled by a switched relay, in which case it’s either on or off, or a dimmer, in which case it could provide some of the light but not all of it for cases where there is some daylight but not enough to read.
The thing is, there can be a considerable cost adder for dimming control, particularly for fluorescent lighting. So the question of whether dimming controls are worthwhile can be stated: for how many hours per year is there some daylight, but less than our target 30fc minimum?

In the above graph, time of day is plotted vs. time of year, with contour lines for footcandle levels. The area where dimming would save energy over switched daylight harvesting is shaded in orange, and it works out to about an hour in the morning and an hour at night. However, the expected operating hours of the library are expected to be 10am to 6pm most days, so it really only comes into play in the winter. There are some additional potential benefits to dimming controls as well, but on the basis of this I recommended that we do dimming controls on the LED fixtures where it could be had easily and inexpensively, and forgo them for most of the fluorescent fixtures.
Forecasting total power consumption: Lastly, I was wanting to get a handle on the real energy usage over the course of the year, as opposed to the total connected load. AGI unfortunately can’t take real climate data for the area as an input, so I used the partly cloudy data set as a rough-and-ready average value.
For each of the twenty or so calculation grids within the space, I identified a target illuminance level for each and totaled up the number of hours each year where daylight contribution was less than acceptable. I used the current operating hours of 10am-6pm four days a week, 12am-8pm two days a week, and closed on Sundays (plus an extra half hour after closing for cleanup).
[table id=20 /]
The lighting energy draw of the main room is about 4000W with everything on, so the Real Lighting Power Density is something like 47.2 KWh/yr. I’m not using a particularly granular or methodical approach here, because in any case the end result is a vanishingly small amount of yearly energy use due to electric lighting. To give some context, according to DOE figures, the office space averages about 6 KWh per year for lighting, per foot. The energy savings to be had by good daylighting design are clearly orders of magnitude greater than the energy savings due to efficient electric lighting design. That’s something to contemplate at a time when code-mandated electric lighting design power densities have reached a point of diminishing returns.
Conclusion: On a typical project, we don’t have time to run a comprehensive study like this, of course. I think that looking at this data, the methodology of generating data points for a morning and afternoon time at the equinox, with bounding points at the winter and summer solstices is validated. I would suggest that for the solstices clear sky conditions be run regardless of the prevailing sky conditions, to generate ‘worst case’ scenarios. One factor that would make this study less general is that the space is primarily lit from above, with skylights, and the angles are such that there is almost never direct sunlight entering the space. For spaces with larger windows, I would expect sun angle and sky condition to produce much more variation in lighting levels. On the other hand, adjustable shading technology is much more available for windows than skylights.
Hope you enjoyed this, it took me months to find the time to generate and assemble and analyze the data. If you have any questions or comments, please feel free to get in touch or drop me a line below!